

White box web application penetration testing is one of my favorite things to do in the security world. If you’re new to this, “white box” means you have access to the source code of the application you’re testing. Keep in mind that the vast majority of what I will discuss in this post actually applies to mobile and API testing, too, and not just web applications. Although, don’t consider this an exhaustive coverage of mobile or API testing.
Why White Box?
I enjoy white box web application testing because having access to source code assists several facets of the process. I’ve whittled it down to just two bullet points that I’ll expand upon.
- Increased speed and coverage
- Increased remediation recommendation quality
At the end of the day, when I say increased speed and coverage, what I mean is that if you gave me forty hours to test a web application, I’m going to get a lot more done in that forty hours if I have the source code. What does this mean for a customer? Well that means they are getting a cheaper test. Since now I can cover an application in forty hours vs. sixty hours.
And since I have the source code, now I can uncover vulnerabilities that I would not have known about before or ones that I think may exist, but are difficult to exploit. A real threat actor has essentially unlimited time to hack away on a target. As a pentester, we don’t have that luxury. We have an allotment of time, and if we can’t exploit something, then it won’t be in the report. So, in this case, the customer is also getting a higher quality test.
Another benefit to the customer is an increased quality of our remediation recommendations. After all, we can see the source code. We can point out exactly what is wrong, and make recommendations as to the exact fix the code needs.
Finding a Target and Source Code
For those of you that are bug bounty hunters, this part is easy. The target application will be in the scope of the bug bounty program. Similarly, if you’re pentester, and you’ve been hired to test an application, well then there is your target.
But what if you’re an independent researcher? How can you find a target, but better yet, how can you get the target’s source code?
When people ask me about testing web applications, I usually just direct them to Github. I tell them to find an open source application that they use day to day, clone it, and start hacking away. Alternatively, look for an app with a decent amount of stars and forks, and clone that. Many of these applications will have a large userbase, but they’ve never actually underwent any security testing. Now is the time to strike!
Not Open Source?
What do you do if the application you want to test isn’t open source? Now you need to do a little more legwork. Here is a non-exhaustive list of options you have to recover the source code.
- Ask the vendor nicely
- Download and decompile
- Leaks
- AWS Marketplace or similar
These methods are mostly self-explanatory, but the AWS Marketplace one is something that a lot of people don’t realize they can do. Anybody and their sister can get on the AWS Marketplace and get trials of all sort of things (or even paid versions that are still cheap). So let’s say there is a proprietary PHP application that you want the source code for and you don’t want to pay the large, flat-rate fee to purchase the app. In that case, there may be a version of it on the AWS Marketplace that only charges you by the hour, or maybe is even a free trial. Tada! Now you have the application and the source code is hopefully on the disk somewhere. Even if you can’t recover the source code in this manner, this is still a good tip for testing in general. It especially comes in handy when testing AV/EDR and not wanting to submit stuff to Virus Total.
Let’s Get to Hacking
So now you have your source code all sitting pretty and you want to hack. The first thing I like to do is load it up in VSCode (nowadays I like Cursor for the built-in AI). VSCode has arguably become the most dominate editor and IDE out there. The plethora of plugins allows you to do essentially anything that any of IDE can do. Do other ones do it better? Yeah, sometimes they do, but VSCode is easily available on every platform, and for demonstrations purposes, it has the widest audience.
In our example today, we are going to use the open source RAMADDA application because the author ran across this app in a vulnerability disclosure program and found some vulnerabilities using methods described in this post.
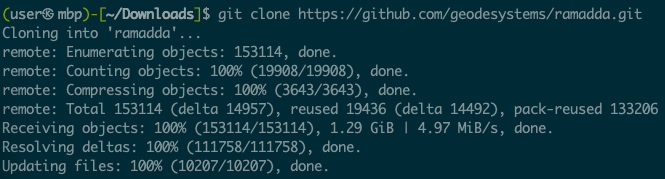
After cloning, cd into the ramadda directory, and then we will follow the directions found in the application README to build the application by running the command ant (which you may need to install).
Per the README, during the build process the dist directory was created which contains the file ramaddaserver/ramadda.sh, amongst others. Opening ramadda.sh in VSCode, we see the command to run ramadda.
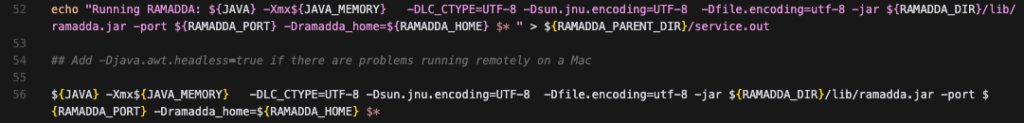
Keep this in mind for debugging purposes, but for now, we are just going to simply run ramadda.sh and go through the setup process which includes setting up an admin password.
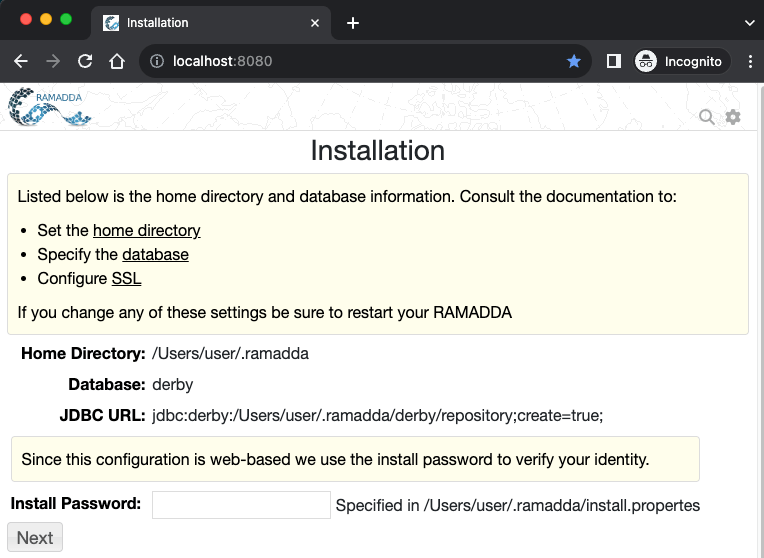
If this was my first time testing this application, I’d take a little bit of time – maybe a couple of hours – and just check out the functionality of the application.
The reason we are doing all of this before we even look at the code, or get debugging going, is because we want to make sure we can get the app running. Sometimes it’s just a big pain. Sometimes it is something you haven’t dealt with before and the directions are wrong and you decide you no longer want to do this. Thankfully, if you’re a bug bounty hunter you can just move on if you can’t figure it out. But if you’re a pentester, that probably isn’t an option.
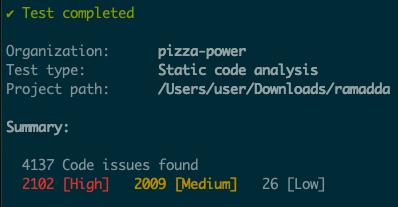
Static Analysis
Now that we know we can run the app, we can pause that, and go back to the code. This is a white box penetration test, after all. In this part of testing we are going to use tooling of our choice to analyze the code. Static analysis tools tend to have a lot of false positives, but they also do find real issues at times, and there is a lot of value in running multiple tools on the codebase.
semgrep
Starting off, we are going to use semgrep. semgrep is an open source static analysis tool that many orgs will use in their CI/CD pipeline to scan their code. Today we will just use it via our CLI. semgrep is easily installed with:
python3 -m pip install semgrepand it can be ran as easily as:
semgrep scan --config autoThis will scan all the code under the current directory. Now, semgrep does a lot more than just this command. You can write custom configurations, run it in the cloud, etc. It’s worth it to investigate what all it can do. In our case, semgrep returns about a billion findings.
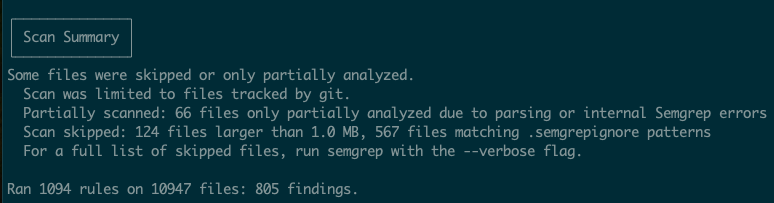
Take some time and go through these. 805 findings seems like a lot, and it is, but you will learn a little bit about the code base by looking at this. You may even find some actual vulnerabilities that you will be able to exploit.
snyk
Snyk is another static analysis tool that is utilized in many of the same ways that semgrep is. While we won’t go into the details of installing snyk, once installed, it can be ran with:
snyk code testAgain, this will return numerous findings – many of which are not of interest to us. And again, go through this thoroughly. Many of them are inconsequential or just flat out wrong. Nonetheless, you will learn about the code base as you do this.
Custom Queries and Other Tools
Semgrep and Snyk are just two of the many static analysis tools that you will find out there. I encourage you to explore many others. I’d also encourage finding a “secrets” scanning tool. Finding hardcoded credentials (passwords, API keys, etc.) in code is still profitable for bug bounty hunters, and still widely abusable in penetration tests.
Also, any penetration tester worth their salt knows of “dangerous” functions in web applications. Let’s say we are testing a python application, one of the first things I will do is grep the code for pickle. I have multiple CVEs and bug bounties from insecure deserialization of python pickles from doing just that.
Debugging
Getting debugging up and running is a crucial part of doing a white box penetration test. It will be a giant pain to get it running sometimes, and you may not have the time to do it if you’re on a pentest engagement, but if you can get debugging running, get debugging running. It will make testing stuff a piece of cake, and I will go out on a limb and say that it is almost required for troubleshooting lots of exploitation scenarios. If you do happen to be a pentester, ask questions about debugging setup during scoping calls or at any other time you can before the engagement starts.
Earlier in the article I mentioned to keep the command to run RAMADDA in mind for debugging purposes. So now we are going to use that command and thankfully VSCode makes debugging fairly simple. To summarize what we will be doing is we will start the RAMADDA applciation via the (slightly modified) CLI command we found above, and then attach VSCode debugger to this process.
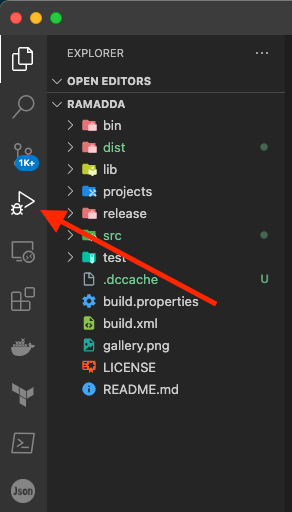
To start, click run and debug in the left hand menu and then click create a launch.json file then select Java.
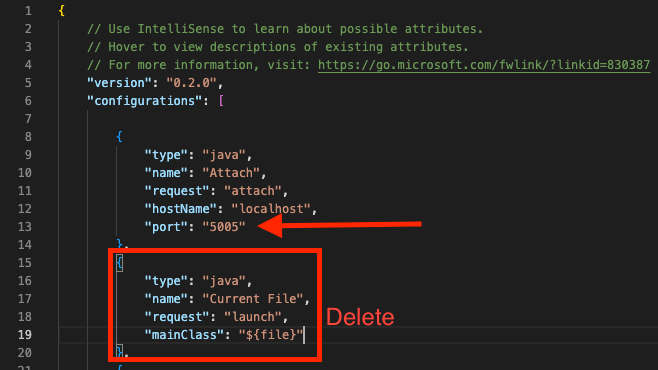
At this point VSCode should have generated a launch.json file, but this one isn’t exactly what we want. Click Add Configuration in the bottom right corner, and select Java: Attach. This will add a Java Attach section to the launch.json file. Update this section by changing the port to 5005, and then delete the Java Current File section of the json.
Now I’ve slightly modified the CLI command we found above to run RAMADDA. I added in some parameters to turn on Java debugging.
java -Xdebug -Xrunjdwp:transport=dt_socket,server=y,address=5005,suspend=y -Xmx2056m -DLC_CTYPE=UTF-8 -Dsun.jnu.encoding=UTF-8 -Dfile.encoding=utf-8 -jar /Users/user/Downloads/ramadda/dist/ramaddaserver/lib/ramadda.jar -port 8080 -Dramadda_home=/Users/user/.ramaddaWhen you run this command, it will wait for you to attach your debugger;

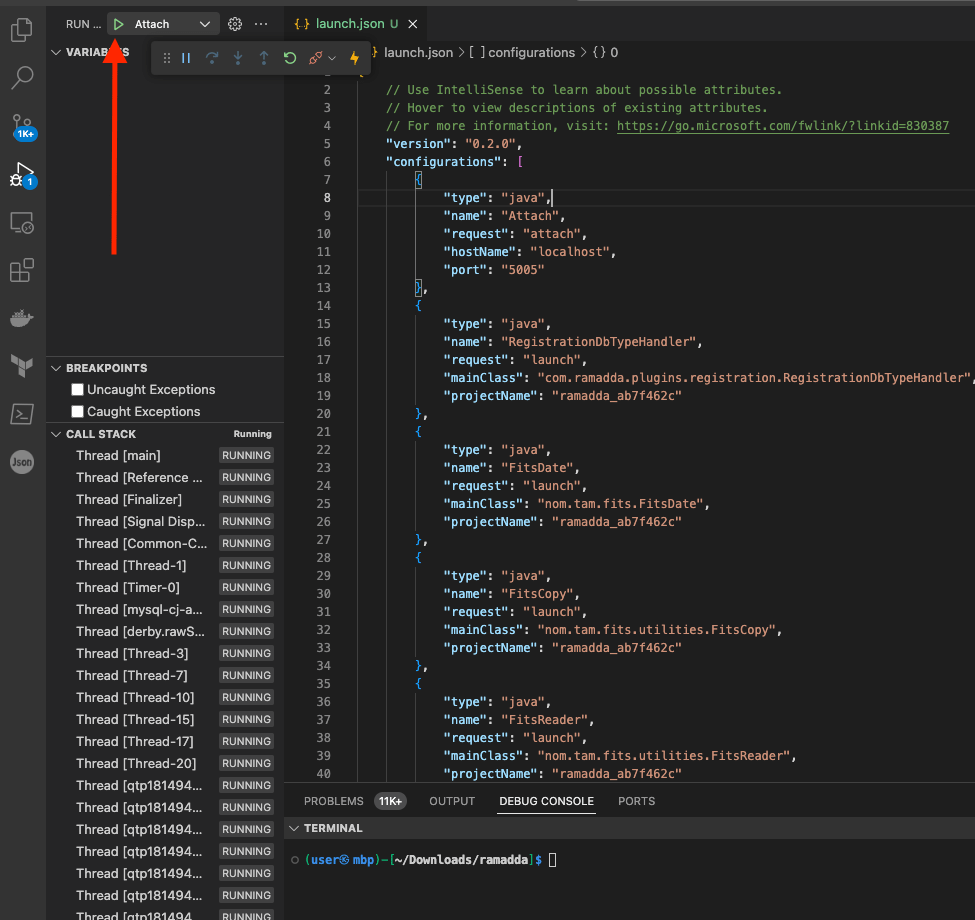
Back in VSCode, hit the green play arrow, and everything will fire up.
If you’re reading this blog, I assume you have some sort of idea as to what debugging is. But for those that don’t, amongst other things, debugging allows you to set breakpoints in the code. What a breakpoint will do is stop the application wherever the breakpoint is set. This allows you to inspect the state of the application. For us, this will come in handy to see where our input goes and how the input is processed. At the end of the day, web application hacking is largely about our inputs and their sanitization, routing, and processing.
Let’s see how this actually works. We are going to set a breakpoint that will get hit when we log in, and we will be able to see our password in the debugger. In the file src/org/ramadda/repository/auth/UserManager.java, click to the left of line 3258. This will put a little red dot, which is a breakpoint.
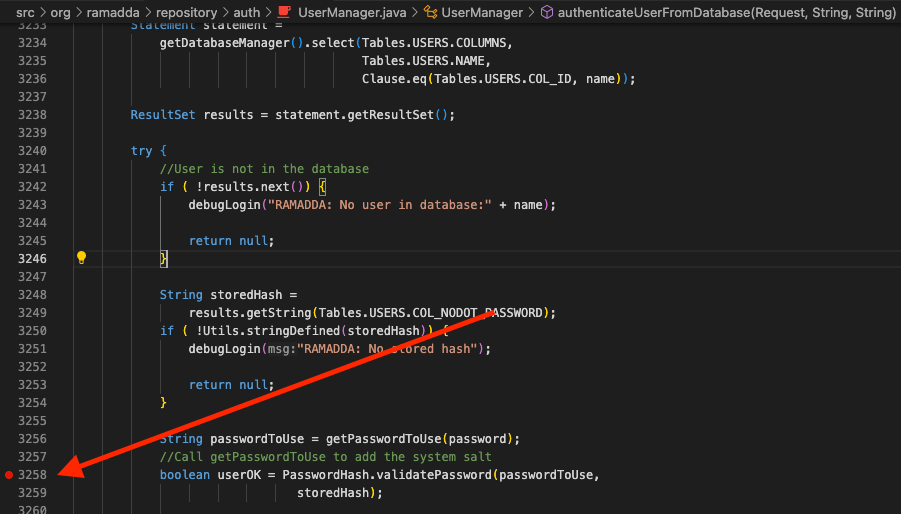
Now, just go the login page and login. The execution of the application will stop, and we will be able to see our password.
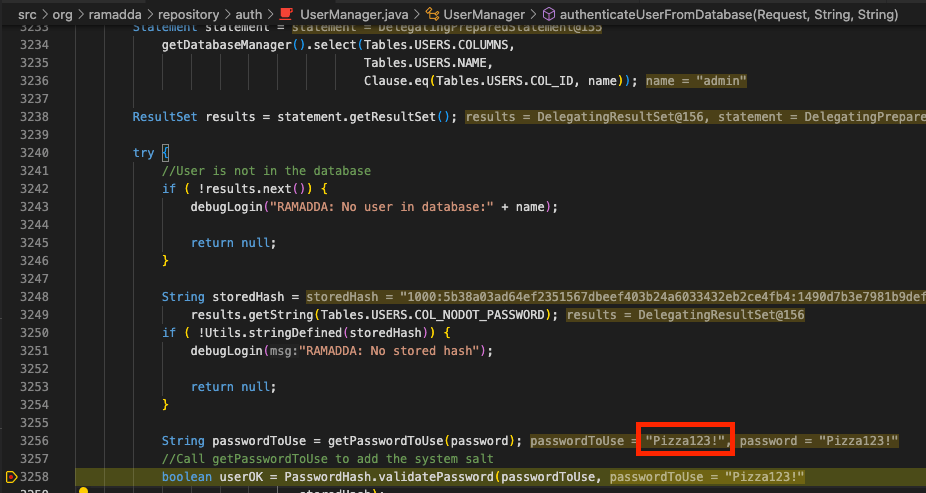
Here we can see the password that I used – Password123!. It should be self-evident as to how this can come in handy testing. Let’s say you found what you think is an SQLi, but there is some sanitization going on. You could simply set a breakpoint and see how you input looks when it gets to the vulnerable code. That way you can troubleshoot your payload. Without debugging, you’d have to manually trace the input through the file – which could be extremely tedious and error prone.
Dynamic Analysis Scanning
Previously we scanned the code with static analysis tools. Now we are going to do some dynamic scanning. There are a lot of tools out there to do this, but since we are pentesters and bug bounty hunters, we are simply going to do this with Burp Suite Professional.
My process of running Burp active scans consists of spidering and navigating through the whole application and attempting to use every bit of application functionality that I can find. After that, I’ll simply right click on the site and select active scan. From there it may take many, many hours to run this scan. I’ll usually just walk away for the evening and let the scan run.
Don’t neglect Burp active scans. But just like static analysis, a Burp active scan will have an immense amount of false positives and inconsequential findings. However, Burp will find real vulns. I’ve personally found many SQLi and XSS from Burp active scans.
Manual Testing
I don’t think this section should really require much explanation, and since this article was written to highlight special activities during white box testing, I won’t go into too much detail on manual testing. If you’re reading this, you’re probably familiar with manual testing anyway. You should be using a web proxy of which there are multiple options these days.
- Burp Suite – The Standard
- Caido – The Up and Comer
- Zap – Old Faithful
- ProxyMan – Now on Windows
I personally use Burp because it has wide support, extensive functionality, and it’s the defacto standard. But since this is a White Box test, you can now simply look at code to see if something is vulnerable. For instance, previously you may have used the Burp plugin Autorize to test authn/authz of API routes. Now you should just be able to look at the code and see if a route forgot to check for authz before it is accessed. This is just one small example, but it should greatly speed up testing.
Burp Plugins
There are many plugins that are technology specific, such as InQL, a GraphQL scanner or ViewSate Editor for inspecting ASP state data. Always look up tech specific plugins and use them as needed.
In my opinion, there are some mandatory Burp plugins. Here are a few that I use on essentially every test or have made me a lot of money.
- Autorize – Check every request for authn/authz.
- Active Scan++ – Adds more checks to your Burp scans.
- Upload Scanner – Have an upload form? You cannot manually test everything
Javascript Analysis
This section will give you the secret in how to change a black box penetration test into a quasi white box test. To start, if you ask any great bug bounty hunter if they look at the Javascript, and their answer will likely be a resounding yes. Unfortunately, I’m sure most of us have looked at some JS files during a black box web application test, and all we saw was obfuscated/minified/etc. Javascript. Nobody has time for that.
This is where the Javascript source map file comes in to play. A JavaScript source map is a JSON file that maps the minified or transpiled JavaScript code back to the original source code. This is particularly useful for debugging purposes. When you minify a JavaScript file, it becomes difficult to read and debug. A source map provides a way of mapping code within a compressed file back to its original position in a source file, which makes it easier to debug issues directly in the source code.
A source map file usually has a .map extension and is typically generated by build tools like Webpack, Babel, or TypeScript compilers. In a minified JavaScript file, you might find a comment at the bottom linking to the source map, like so:
//# sourceMappingURL=your-file.min.js.map
After proxying through Burp for a while, simply just search the proxy history for sourcemap and you’ll find the link, if it exists. If you want to take all this code offline and perform a quasi white box test, you can use a tool such as sourcemapper to download and beautify all the code, turning the black box test into a white box test. I’ve personally used this to find many bugs in bug bounty programs.
Source maps aren’t the only interesting thing about Javascript. Often you can find hardcoded credentials, API Keys, or hidden functionality by simply grep’ing a JS file. Also, don’t forget that you can use the browser console to debug Javascript just like we did in VSCode above!
Read the Docs
I suppose this isn’t solely for white box tests, but I can’t tell you how often I have seen testers disregard application documentation. Read the docs! Sometimes you’ll find that RCE is simply a built in functionality of the application.
Artificial Intelligence
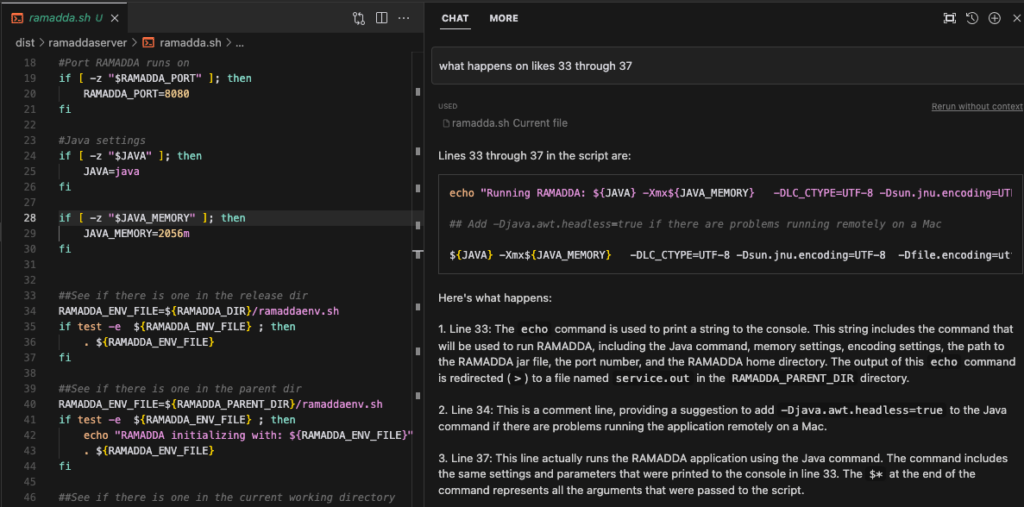
If you aren’t paying for ChatGPT, you should be. Anyway, during a white box test, you’ll be looking at a lot of code. Much of this code you’ll have no idea what it is doing. After all, we can’t be experts on every programming language out there. This is where ChatGPT or Cursor come into play.
Just copy/paste into ChatGPT and ask it what the code does or just ask Cursor what happens. No need to struggle for an hour figuring it out. This DRASTICALLY speeds up testing.
Outro
Although we didn’t go too in depth in finding actual vulnerabilities, after reading this you should have a better idea of some additional activities that should take place during a white box penetration test vs. a black box test. I hope you also got some new tips of things to use during your testing. But one thing is for certain, at the end of the day, a white box test is better for the testers and better for the clients
Keep your eyes peeled for more custom blog posts by the Brackish experts. And as usual, if you’re looking for someone to test your web applications, mobile applications, or APIs reach out to Brackish Security!